The goal of winaRaque is to explore sport data and make analysis with sport betting odds. The first analyzes will be done through the NBA.
Installation
You can install the development version of winaRaque from GitHub with:
# install.packages("devtools")
devtools::install_github("Alexis-vs/winaRaque")
Example
You can get NBA results with 1/2 odds for a day.
library(winaRaque)

get_nba_scores("2023-10-30", pivot_results = TRUE)
#> # A tibble: 22 × 13
#>    day_match   matchId set       Name    Odd WINLOSE   PTS FG_PCT FG3_PCT FT_PCT
#>    <date>        <int> <chr>     <chr> <dbl> <chr>   <dbl>  <dbl>   <dbl>  <dbl>
#>  1 2023-10-30 43065447 Competit… Atla…  2    W         127  0.558   0.467  0.944
#>  2 2023-10-30 43065447 Competit… Minn…  1.76 L         113  0.489   0.485  0.6
#>  3 2023-10-30 43065441 Competit… Char…  1.92 L         121  0.49    0.258  0.95
#>  4 2023-10-30 43065441 Competit… Broo…  1.84 W         133  0.563   0.364  0.719
#>  5 2023-10-30 43065459 Competit… Denv…  1.25 W         110  0.56    0.321  0.412
#>  6 2023-10-30 43065459 Competit… Utah…  3.75 L         102  0.429   0.297  0.467
#>  7 2023-10-30 43065443 Competit… Indi…  1.62 L         105  0.409   0.261  0.84
#>  8 2023-10-30 43065443 Competit… Chic…  2.2  W         112  0.46    0.353  0.839
#>  9 2023-10-30 43065461 Competit… Los …  1.74 W         106  0.532   0.296  0.778
#> 10 2023-10-30 43065461 Competit… Orla…  2.05 L         103  0.4     0.4    0.722
#> # ℹ 12 more rows
#> # ℹ 3 more variables: AST <dbl>, REB <dbl>, TOV <dbl>
Small data visualization
# the workflow has been taking the odds since 2023-03-20
seq_date <- seq.Date(from = as.Date("2023-10-24"), # NBA opening 2023-2024
                     to = Sys.Date(),
                     by = "day")
list_results <- lapply(seq_date, get_nba_scores, pivot_results = TRUE)
results <- do.call("rbind", list_results)
library(ggplot2)
library(dplyr)
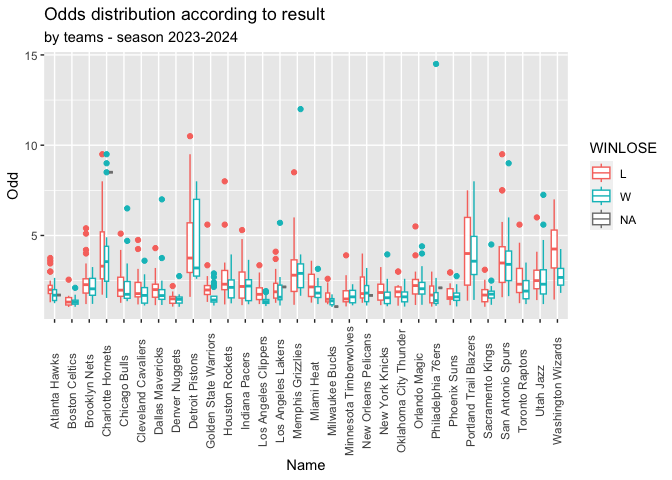
results %>%
ggplot(aes(x = Name, y = Odd, color = WINLOSE)) +
geom_boxplot() +
theme(axis.text.x = element_text(angle = 90, vjust = 0.5)) +
ggtitle("Odds distribution according to result", subtitle = "by teams - season 2023-2024")